In this post, I'm going to do a basic setup of my ASA with Firepower. I'm not going to dig too deep into individual policies since those should be dedicated to their own blog post. Instead, I'm going to go through the basic setup of the ASA and the Firepower Management Center (FMC).
To start, I'm going to configure the ASA side of things. The first thing I'm going to do is configure the domain name and time information:
clock timezone UTC 0 <- I like using UTC as my timezone due to the fact that it makes logging easier across all devices
ntp server 10.1.100.1 <- Configure the NTP server that all your devices in your lab or production will be using
dns domain-lookup inside <- Uses the inside interface for DNS look-ups
name-server 10.1.100.40 <- The DNS server
Next I will be configuring the class-map and policy-map to forward traffic to the internal Firepower module for inspection:
class-map SFR <- creates the class-map
match any <- Matches ALL traffic. You can also create an ACL and have it match the ACL instead
policy-map global_policy <- brings you into the global_policy context
class SFR <- Adds the class to the policy-map
sfr {fail-open | fail-close [monitor-only]} <- There's a couple different options here. The first one is fail-open which means that if the Firepower software module is unavailable, the ASA will continue to forward traffic. fail-close means that if the Firepower module fails, the traffic will stop flowing. While this doesn't seem ideal, there might be a use case for it when securing highly regulated environments. The monitor-only switch can be used with both and basically puts the Firepower services into IDS-mode only. This might be useful for initial testing or setup.
Next we will enable the management interface:
interface management 1/1
management-only
nameif management
security-level 100
no shut
After configuring this, we'll need to login to the Firepower module of the ASA by issuing the following command:
session sfr console
At that point, use the default username/password to login. If you're using Firepower v5.4 or below, the default credentials are admin/Sourcefire. In later versions of Firepower v6.x and above use the default credentials of admin/Admin123. In my lab, I'm using Firepower 6.0.1. After initially logging in, you will have to accept a EULA agreement and then be given an option to configure network information. In the event you do not get this and you just get the ">" prompt, enter the following to configure the IP information:
configure network ipv4 manual <ip-address> <network-mask> <gateway>
After configuring the IP address, we will next configure the Firepower module to point towards the Firepower Management Center for management:
configure management add <FMC-IP-Address> <shared-key>
Next we will start the Firepower Management Center and login with the default credentials. We will still need to configure the network by issuing the following command:
sudo configure-network
It will walk you through the network configuration script. After you have configured all the applicable information, it will save the configuration. Open up your browser and navigate to the IP address that you just configured for the FMC and login with the default credentials. You should get the following page:
On this page, fill out the following:
- New password
- IP address, mask, and default gateway (if it needs to be changed)
- Hostname of the FMC
- Domain for the FMC
- DNS server information
- NTP server information or manually set the clock
- Set the timezone
- Whether or not to install the updates and rule updates
- Upload and apply licenses if using classic licenses
Click Apply when done and it should take a little time for this to apply to the FMC.
After the configuration has updated, you will be in the FMC GUI. Navigate to Devices>Device Management and click Add>Add Group. This is an optional step but you can create logical groups here to add your devices to for ease of management and organization. Then click Add>Add Device to add your Firepower module from your ASA using the IP address you just configured:
In this window, you would fill out the following:
- Hostname or IP address of the device
- Display name of the Device for the FMC
- Shared key that you previously used in the when configuring the Firepower module
- (Optional) Group
- Access Control Policy - The device needs to have an access control policy assigned to it to be added. If you haven't created one, you can choose New from the drop-down and create one with a base policy of the following: Intrusion Policy (and optionally choose a base policy), Network Discovery or Block all traffic
- Then choose the licenses that will be applied to the device including Protection (intrusion detection and prevention, file control, and Security Intelligence filtering), Control (user and application control), Malware (network-based Advanced Malware Protection), URL Filtering (category and reputatio-based URL filtering), and VPN (7000/8000 appliances only. N/A on ASA with Firepower)
- There is a optional setting for NAT ID under Advanced Settings. This is a unique key for configuring Firepower devices over the internet that need to go through a NAT. I'm not going to configure this in my lab.
Click Register when done and join the device to the FMC for management. This might take a few minutes while the Access Control Policy is applied. After the device is connected, click on the name of the device in the Device Management. Choose the interface tab and edit the interfaces. Here you can create an "inside" zone and "outside" zone corresponding with each interface. This is not necessary but it can help for creating Access Control Policy rules later based on the source and destination zone:
I also like to set up my email settings for alerts. To do so, navigate to System>Configuration>Email Notification and enter your email settings:
Note: If you're setting up Gmail for your home lab, Gmail requires you to configure in your settings to allow mail relay in gmail. Click here to learn how to do so.
Other settings that you might want to be aware of under System>Configuration:
- Access List - Configure an access list for what networks and ports can access the FMC
- Process - This is where you can shutdown and restart the FMC
- Login Banner - Configure a login banner for people who will be logging into the GUI or the CLI of the FMC
- SNMP - Configure an SNMP string for the FMC
- Change Reconciliation - To have changes emailed to you at a specified time
I will create a platform policy that will configure some system configuration settings for the managed devices. Navigate to Device>Platform Settings and click on Add Policy. In this policy, I'll make sure that the device is syncing it's time with the same NTP source as my FMC. You can also optionally configure a login banner, SNMP settings, access lists and other settings for the managed devices:
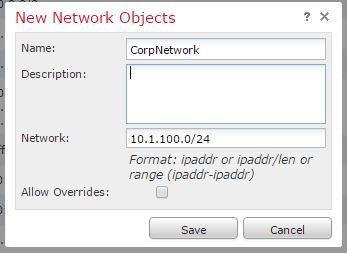
Navigate to Object>Object Management to create network objects and network group objects to define your networks as objects. Click Add Network>Add Object to add a single network object:
After you've added all your subnets or interesting subnets, you can group them together as a network group object by clicking on Add Network>Add Group and all the network objects that might make up your corporate network:
These network objects and groups can be used as a foundation to the intrusion policy by adding them to the variable set. The variable sets represent commonly used values in the intrusion rules to identify source and destination IP addresses and ports. The HOME_NET variable in the variable set is the "protected" networks. You can create multiple variable sets to apply to separate intrusion policies and the reason you might do this is that you might want one variable set where the HOME_NET variable is defined as your inside hosts, another variable set where it's defined as your DMZ hosts and maybe a completely different one where your guest subnets are defined. This way you can have different types of intrusion policies with different IPS rules that are protecting different protected networks.
To define a variable set, navigate to Objects>Object Management>Variable Set and click on Add Variable Set to create a variable set. The initial configuration of the variable set will be based upon the Default-Set but you can change it to anything you would like. Likewise, you can also modify the default set if you don't see yourself using multiple variable sets in your lab or enterprise:
Scroll down to HOME_NET and click the pencil to edit:
In the window that pops up, choose the network or network group objects you created and add it to the included networks:
Click Save and then click Save again to save this variable set.
Network Discovery is the policy used to collect host, application ad user data traffic from the network. This information is used to build a comprehensive map of the network assets, performs forensic analysis, behavioral profiling, access control, and mitigate and respond to vulnerabilities. To modify the network discovery policy, navigate to Policies>Network Discovery. Here you can either add a rule or edit the default policy by clicking the pencil:
In this case, I'm just going to click the pencil. The default policy does network discovery on any network. This is not ideal for two reasons:
1) This means that Firepower will be trying to profile and create a host profile for every IP and host it sees pass through the system including hosts from the internet.
2) This is a waste of resources and there is a host limit on any appliance. You don't want to hit that limit because of webpages and other profiled hosts on the internet
After clicking the pencil icon, I recommend adding your network object groups and I usually like to check the box next to Users to include user discovery:
After clicking Save, click on the Users tab of network discovery. This is where we can modify the non-authoritative traffic-based detection rules. I usually like to turn off SIP and FTP since you can have anonymous FTP users and SIP isn't always the ideal thing to use for user information:
There's a lot more settings that can be configured under the Advanced tab but I'll dig into that in later posts.
After changing the network discovery policy, click Deploy at the top to push the configuration changes to your managed devices:
I'm going to configure the intrusion policy next by navigating to Policies>Access Control>Intrusion and clicking on Create Policy. For this policy, I'm going to check the box next to Drop when Inline and I'm going to choose the Balanced Security and Connectivity base policy.
Click Create and Edit Policy.
On the Edit Policy page, there are a few things I'd like to call out. If you click on the Firepower Recommendations on the left. On this page, you can click the button for Generate and Use Recommendations or Generate Recommendations to have Firepower generate recommended rules to be enabled or disabled based on the hosts, applications and protocols that have been discovered through network discovery. This is a good way to have Firepower customize the IPS rules based on the hosts on your network.
Click on Rules on the left-hand side and from the filter box, you can enter words that will help you filter the rules. One I would recommend filtering for is blacklist. After filtering for it, it'll pull up all the blacklist rules. Check the box next to the individual rules or the top to choose all rules:
On the top, click Rule State to change the state of the rules. You can choose Generate Events which will generate events but allow the traffic to flow. Drop and Generate Events which will generate events and block the traffic. Disable will completely disable the rule. Typically, I'll filter for blacklist, PUA (Potentially Unwanted Application), Indicator of Compromise, and Exploit Kit and enable the rules for them.
If you enable all these rules, I would recommend doing one more thing. Filter for 1201, check the rule INDICATOR-COMPROMISE 403 Forbidden and under Rule State, choose Disable:
If you need to see the details for any of the specific rules, click on the rule itself and then the Show Details button at the bottom:
You can see from this rule that it occurs when the 403 error response code is returned to a client by a webserver. It's probably not a rule we want to enable because we enabled all the other indicators of compromise so disable it:
Click on Policy Information on the left-hand side and then click Commit Changes:
Now we're going to create our malware policy which will be the AMP portion. Navigate to Policies>Access Control>Malware & File and choose New File Policy. Name this policy whatever you feel comfortable with and then click Save.
This will bring up the file policy. Click Add Rule to create your first rule. There are a few different options we can choose. You can specify the application protocol to inspect:
In my case, I'm going to leave it at Any.
You can also specify the direction of the transfer. You might not care if it's files being uploaded to the internet and might only want to inspect downloads:
Again, I am going to leave it at Any.
You have a couple of different options for the Action types:
- Detect - This detects just the file type. No other action is taken
- Block Files - This blocks the file type specified
- Malware Cloud Lookup - This checks the AMP cloud to see if it's malware but takes no other action is the disposition comes back as malware
- Block Malware - This checks the AMP cloud for malware and blocks malware if it's determined to be malware
In my file rule, I'm going to choose Block Malware. Under that, I have several options:
- Spero Analysis for MXEXE - This sends the metadata for executable files which can be used to detect malicious files
- Dynamic Analysis - This is for enabling unknown files to be checked and sandboxed with the ThreatGrid cloud
- Capacity Handling - This will attempt to store the files for later processing if they cannot be sent for dynamic analysis immediately
- Local Malware Analysis - Allows the managed device to locally inspect files for the most common types of malware using detection rule set provided by Cisco Talos
- Reset Connection - This will reset the connection on blocked malware instead of letting it time out. I would definitely recommend this option
You also have the option to store files of a certain dispositions if you wish. I'm not really concerned about it in my lab:
In my first rule, I'm going to block malware and enable Spero analysis and dynamic analysis for office documents, PDFs, executables, local malware analysis capable file types, dynamic analysis capable file types, and archives:
I'm going to create another rule to detect files for the remaining file types:
Optionally, you can click on the Advanced tab:
The settings under here are as follow:
- First Time File Analysis - Submit a file for file analysis that the system detects for the first time if the file matches a rule configured to perform a malware cloud lookup and Spero, local malware or dynamic analysis. If this is disabled, first time files are marked with unknown
- Enable Custom Detection List - Check this box to use your custom detection list object which contains a list of SHA-256 values that will be considered malware
- Enable Clean List - Select this box to enable your clean list object that contains SHA-256 values that will always be considered clean regardless of their cloud disposition
- Mark files as malware based on dynamic analysis threat score - Has four subsettings:
- Disabled - Files will not be considered malware based on dynamic analysis
- Medium - Score of 26 or above
- High - Score of 51 or above
- Very High - Score of 76 and above
- Inspect Archives - Enable to inspect the content of archived files
- Block Encrypted Archives - Allows you to block archive files that have encrypted contents
- Block Uninspectable Archives - Block archive files with contents that the system is unable to inspect for reasons other than encryption - usually for corrupt files or those that exceed your maximum archive depth
- Max Archive Depth - Allows you to block nested archive files that exceed a specific depth; top-level archive file not considered in this count; depth begins at 1 with the first nested file
When you are done creating your file policy, click Save.
The last thing to do to tie this all together is to create the Access Control Policy by navigating to Policies>Access Control>Access Control and either editing the existing policy to click Add Policy to create a new one:
Click Add Rule to add your first rule. For the rule, you have the following actions you can take on a rule:
- Allow - Allows the matching traffic to pass through the device. You can also inspect the traffic using an IPS policy, file policy or both
- Monitor - Doesn’t affect traffic flow - only purpose is to log a connection event. Traffic matching this will result in a connection event and traffic will proceed down the rule set, potentially matching another rule or the default action
- Block and Block with Reset - Deny traffic without further inspection. Block simply stops the traffic from passing while Block with Reset resets the connection
- Interactive Block and Interactive Block with Reset - Allows users to bypass a website block by clicking through the warning page.
There are also several tabs you can use to define your rule:
- Zones - Used to limit rule to traffic coming into or going out of specific interfaces
- Networks - Detail any combination of individual IP addresses, CIDR blocks, and prefix lengths. Clicking the Geolocation tab reveals available geolocation objects that you can use to define rules
- VLAN Tags - Allows you to specify a number from 0 to 4094 to identify a network by VLAN.
- Users - Specify which users your rule should apply to, with users and groups being retrieved from an Active Directory server. On this access control rule, you can have it populated with the Available Users or AD groups
- Applications - Filter based on applications provided by Firepower, user-defined applications and any application filters you created in Objects.
- Ports - Specify source and/or destination ports for the rule. Use a previously created one or default port objects
- URLs - Allows filtering based on Firepower-provided categories and reputations as well as user-created URL objects. Can also enter a URL in the field at the bottom to make sure the rule matches it
- SGT/ISE Attributes - When pxGrid is enabled and ISE integration works, can utilize objects from ISE in the policy like SGT tags
- Inspection - How to control how traffic that matches this rule will be inspected - Certain action types will cause this to be greyed out (Trust, Monitor, Block and Block with Reset) since they don’t allow for additional inspection.
- Logging - Controls the behavior of connection and file event logging. Will not affect logging for IPS or malware events since these will be logged based on the IPS and file policies.
- Comments - Add rule comments optionally.
For my first rule, I'm just going to create a rule to monitor web traffic and not take any action on it:
The next rule, I'm going to block social media and I'm going to make sure to go to the Logging tab to make sure the connection is logged:
The next rule will be to apply my intrusion policy and file policy to the rest of the traffic going through. I'm also going to make sure to use the new variable set that I created and log the connections:
This is what the rules will look like in the end:
Next I'm going to click on the Security Intelligence tab. Here is where we can configure policy based on IP, URL, and DNS feeds provided by the Cisco Talos Security Intelligence and Research Group and/or our own custom lists and feeds we create. Anything on these lists can be blocked prior to access control rules so the malicious traffic can be blocked without further inspection or wasting resources if it's going to a known bad actor.
There are the following custom feeds that are provided by Cisco:
In my Access Control Policy, I'm going to move these feeds over to the Blacklist and by clicking on the icon next to each feed, I can define the action to take on it. You can choose to Block or Monitor-only:
In the end, this is what my Security Intelligence tab looks like:
There are a lot more options on the HTTP Responses and Advanced tab but I'm going to dig into those in later articles. Instead, I'm going to save my Access Control Policy and then click Deploy to push it out to the managed device.
After that is complete, you can navigate to Overview>Dashboards>Summary Dashboard and view some of the traffic going through it:
The dashboards are a good way to get a high level view and they're highly customizable so you can create your own the displays only the information you want to see. Another good one to view is Analysis>Context Explorer which shows a lot of dynamic views for different information:
What I like about this screen is the Filter box on top where I can drill down to one host or a number of criteria:
This isn't the only way to view information. Under the Analysis tab, there are many different workflows you can use as well as building your own but I'll go into that in later posts.